 |
LdP Line, user manual
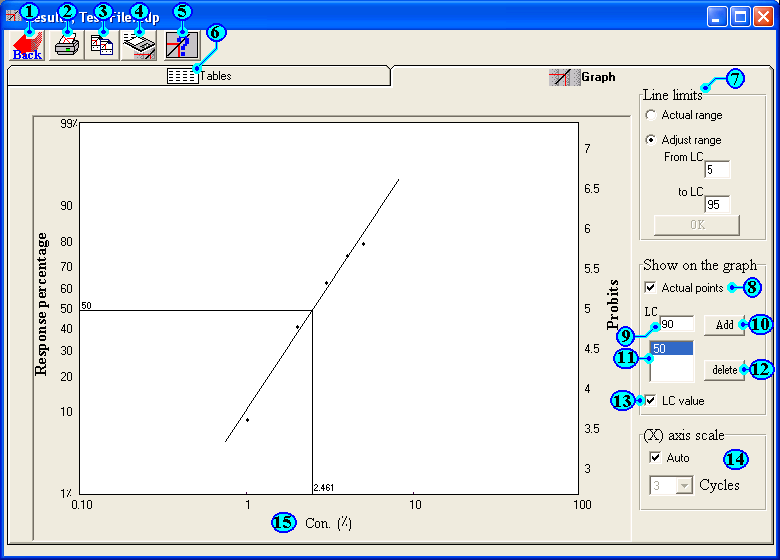
Result window (graphic)
 |
Description of
Results window (graphic) contents.
| 1 | Back button: | Allow you back to main window to edit or modify your data. |
| 2 | Print button: | Display print dialog box |
| 3 | Copy button: | This button allow you to copy tables when tables are displayed and copy graphic when graphic is displayed. |
| 4 | Save results: | Save current results into files. Tables will be saved into Excel file and graph will be saved as bmp file. |
| 5 | Help button: |
Display related help |
| 6 | Tables: | Display Tables sheet |
| 7 | Line limits: | This option allow you to set line limits. You can draw the line between lowest and highest doses or extend the line between two given values. |
| 8 | Actual points: |
Display the actual tested points on the graph. |
| 9 -- 12 |
Show the incidences: | To show the incidences of any LD on X & Y axis. First write certain LD or LC in field (no. 9) then click on add button (no. 10). That will add certain value to list (no. 11) and draw incidences. As it is illustrated above by LC50. Use button (no. 12) to delete selected LD. |
| 13 | display LD value: | Display certain LD value near vertical incidence. In the above example the LD50 is 2.461. |
| 14 | X axis scale: | To set the scale length of X axis. You can leave it auto or set it your self. |
| 15 | Footer field: | If you need to edit this field just click on it, that will allow you to edit it. |